
Republicans say it’s President Biden. With their usual remote relationship with “truth,” they blame the current President for gas and grocery prices. They are not much interested in complex explanations of post-pandemic supply chains, the continuing power of the Middle Eastern oil producers, or anything beside the facile narrative that “it’s Biden.” Now, of course, they have to shift targets to Kamala Harris, which is proving difficult.
For those who still have functioning minds, it’s interesting to look at some facts.
GAS PRICES
Reuters reported in February 2024 that Exxon Mobil posted a better-than-expected $36 billion profit for 2023. That same month the Statista Research Department reported that Chevron Corporation’s net income in 2023 was $21.37 billion.
Here are the top 15 in 2023 as reported by the Natural Resources Defense Council (NRDC):
Exxon Mobil $36 billion
Chevron $21.37
Shell $19.36
Total Energies $21.38
Conoco Phillips $10.96
Valero Energy $9.15
BP $15.24
Phillips 66 $7.02
EOG Resources $7.59
Cheniere $9.90
Pioneer $4.89
Occidental $3.77
Diamondback $3.34
Marathon $1.45
Hess $1.38
TOTAL $172,813,000,000
That’s just shy of $173 BILLION in profits in one year.
Source: Natural Resources Defense Council https://tinyurl.com/h7ku2x9z
Hard as it may be to believe, those numbers represent a decline from 2022. Per the New York Times, “The companies’ earnings were down from the bonanza year of 2022, when a surge in prices pushed up profits, but were otherwise the strongest in recent history.” Oil Giants Pump Their Way to Bumper Profits https://tinyurl.com/38zs2eb2
If you’re also wondering how prices are set at the pump and what explains the variation, often substantial, between gas stations only a block apart, I can’t help you. Most of the online sources I have reviewed argue that the pump price is simply a result of supply and demand. That claim may be true, but it makes no sense to me in casual observation of prices and price changes where I have lived and traveled. Moreover, I have seen almost instant price changes occur at the pump at nearby stations following announcements of OPEC price fixing changes for oil produced in the Middle East. This seems inconsistent with the supply-demand concept since the per-barrel prices set by OPEC do not relate to gas delivered to the pumps the very next day.
DRUG PRICES
Ranking of 20 largest pharmaceutical companies in the world by annual profit and profit per second (31,536,000 seconds in a 365-day year):
-
- Pfizer $31.37 billion ($995)
- Johnson & Johnson $17.94 billion ($569)
- Merck $14.52 billion ($460)
- Roche $13.00 billion ($412)
- AbbVie $11.84 billion ($375)
- BioNTech $10.34 billion ($328)
- Sanofi $8.80 billion ($279)
- Novo Nordisk $8.80 billion ($270)
- Moderna $8.36 billion ($265)
- Novartis $7 billion ($222)
- Amgen $6.55 billion ($208)
- Bristol-Myers Squibb $6.33 billion ($201)
- Eli Lilly $6.25 billion ($198)
- Abbott $5.80 billion ($184)
- GSK $5.30 billion ($168)
- AstraZeneca $4.70 billion ($149)
- Gilead Sciences $4.59 billion ($146)
- Bayer $4.40 billion ($140)
- Regeneron $4.34 billion ($138)
- Merck KgaA $3.50 billion ($111)
TOTAL $183.73 billion ($5826)
That’s just shy of $184 BILLION in profits in one year [2022, latest I could find] Source: The Biggest Pharmaceutical Companies in the World Ranked by Profit per Second https://tinyurl.com/42cjhjn6
If you’re wondering where all that money went, you get a good idea from reporting by the Senate’s Health, Education, Labor, and Pensions (HELP) Committee:

One explanation of all this may be read at CorporateWatch.org: VACCINE CAPITALISM: FIVE WAYS BIG PHARMA MAKES SO MUCH MONEY https://tinyurl.com/3f4fhhpa
I understand the argument that the Pharmas do a lot of research/development that does not lead to marketable outcomes, BUT that money is already accounted for in the final profit figures. Stated differently, research/development costs are in the expense side of the calculus that NETS the profits in the chart. Wouldn’t it be interesting to know in detail what a normal day looks like for managements at, say, Merck that warrants compensation of $60.5 million in one year?
GROCERIES
According to Forbes, groceries are 30 percent more costly now than four years ago, Why Your Groceries Are Still So Expensive https://tinyurl.com/4245t4kb
While noting that “industry leveraged pandemic-related supply chain crises to raise prices and reap enormous profits, all while selling less food,” Forbes, of course, blames this on an “’ongoing policy failure by the Biden Administration.” I will return to that claim in a bit.
Forbes’ analysis of food price inflation states the following:
The U.S. grocery industry is a $1.03 trillion behemoth. According to data shared … by NIQ, across all grocery categories in all channels of trade, prices are up nearly 30% since 2019, while unit volumes are flat. What does this mean? Average shoppers are spending more money and coming home with less food. And Ozempic has nothing to do with it.
Despite the illusion of variety, most grocery categories are dominated by a handful of consumer packaged goods (CPG) companies that own troves of familiar brand names.
Soft drinks provide a textbook example of CPG domination. The top 3 companies, Coca-Cola, Pepsico and Keurig Dr. Pepper, control around 90% of the soda market. Overall, soda sales are up 56%, unit volumes are down 2% and prices are up 59%. In Q1 2023 for example, Coca-Cola prices were up 9%, and Pepsico prices were up 16%, while unit volumes were down 2%. Pepsico more recently posted a 21% rise in operating profit to $970 million, with a 6% volume decline after double-digit price increases for 7 consecutive quarters – nearly 2 whole years. As an executive bluntly stated, “I still think we’re capable of taking whatever pricing we need.”
Kraft Heinz dominates the packaged cheese category at 65% market share. Category unit volumes are up just 6%, while prices are up 21%. That is exactly the intention. “We are not going to be chasing volume,” according to the Kraft Heinz CEO, “We’re going to be looking to drive profitable volume.”
In 2022-2023 Kraft Heinz profits skyrocketed from $225 million to $887 million, an increase of 448%. Gross profit margins reached 34%, up 400BP over Q3 2022.
Similarly, chocolate candy sales are up 34%, unit volumes are down 8% and prices are up 46%. The top 3 companies, including Hershey’s, Mondelez and Mars, possess over 80% market share. Hershey’s CEO said in 2022, “Pricing will be an important lever for us this year and is expected to drive most of our growth.” Hershey’s saw a 62% increase in profits in 2021. Hershey’s 30 brands control at least 46% of the candy category.
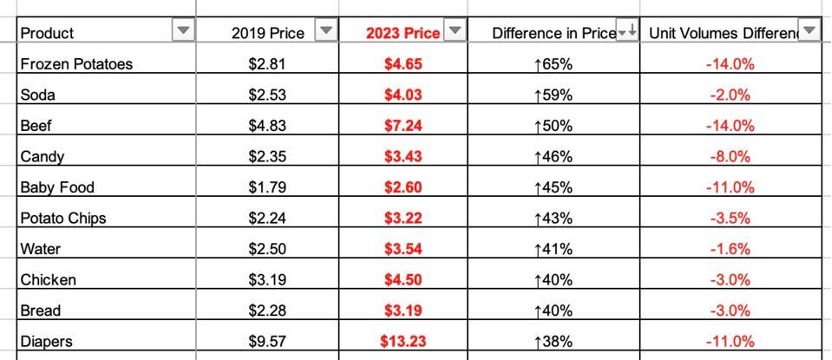 Top 10 price increase and volume trends across all grocery channels, 2019-2023. Data Courtesy of … [+] ERROL SCHWEIZER
Boxed cereal dollar sales are up 17%, unit volumes are down 12% and prices are up 33%. The top 3 brands, General Mills, Kellogg’s, and Post Holdings possess over 70% market share. “It’s been surprising how resilient the consumer really is,” stated Kellogg’s Chief Executive Steve Cahillane in 2022, without a hint of irony.
Beef demand is highly elastic. As prices go up, volumes go down. According to NIQ, beef unit volumes are down 14%. Prices have gone through the roof, up over 50% in just 4 years. The average beef price per pound is now over $7. So it wasn’t Impossible Burger or cultivated lab meat that killed demand. And no wonder. The top 4 meat processors hold around 50% market share. Tyson Foods doubled its profits from 2021-2022, dryly stating in an earnings call, “Our pricing actions, which partially offset the higher input costs, led to higher sales during the quarter.”
Diaper unit volumes are down 11.7% while prices are up 38%, to over $13 a pack. Proctor & Gamble (P&G) and Kimberly Clark control 70% of the domestic diaper industry. P&G prices have stayed high while lower input costs drove 33% of their profits. The brand predicted an $800 million windfall, and an executive recently mentioned, “We continue to believe that the majority of that growth will be price driven with a negative volume component.”
Multiple other product lines show the same pattern of reduced sales volumes accompanied by much larger percentage price increases: milk, yogurt, fresh potatoes, potato chips. The yogurt industry concentration (four firms with aggregate 70 percent of market) resembles the airline industry where four firms have about 70 percent of sales. And, according to Forbes reporting of NielsenIQ data, increases in prices of base ingredients are lower than the increases for processed commodities made from those ingredients.
Price inflation takes other forms than straight-up increases – package sizes are often reduced while price is held constant (called “shrinkflation”). Data also exists showing that corporate profits (income after accounting for expenses) accounted for more than half of inflation.
While media and large companies often assign blame for inflation on consumer demand and workers demanding higher pay, Forbes shows that “corporate profits as a share of the national income are at historic highs, while workers’ share is lower than before the pandemic.” And, “Wall Street profit rates are the highest since World War II and stock buybacks are at record highs.” A good argument exists on the known facts that the largest concentrated industries are taking advantage of the pandemic and its aftermath to extract monopoly profits from consumers.
Instances of suppliers withholding product from uncooperative retailers refusing price pass-throughs are strong evidence of the effects of market concentration. Only firms with market power can successfully withhold product from the market without loss of business.
Finally, for present purposes, energy cost inflation, driven by multiple largely uncontrollable factors, are running persistently higher than general inflation. https://www.vox.com/technology/366885/utility-power-bill-price-clean-energy
Returning to the question whether price inflation is chargeable to the government, the Forbes article suggests Congress could act, along with the USDA and FTC, all targets of Republican angst over government overreach and the “deep state.” There are statutory tools available, for sure, but using them effectively in the face of massive Republican resistance is not a hopeful path to a solution and would in any case consume many years of litigation. Recall the hysterical Republican response to the budgeted increase in IRS staffing which, properly understood, would have resulted in hiring more staff over several years and largely made up for historical reductions in staff that have impaired collection work and return processing. And it certainly would not have led, as Republicans claimed, to armed IRS agents shooting people over tax obligations.
The Congress as currently constituted is not going to cooperate in any legislative efforts to further regulate large American businesses. And the Supreme Court has eviscerated one of the main supportive legal principles (“Chevron deference”) that enabled federal agencies to act aggressively under general legislative authorities to regulate highly-concentrated industries that are responsible for most of the inflation.

They destroy competition;
They control the courts;
They destroy Unions;
They pay slave wages
LikeLike
This is really good stuff!
LikeLiked by 1 person